A year following the Camp Fire, details and further understanding of California’s deadliest wildfire continue to emerge. On Thursday, Feb 5th, Peter Hansen, an IT consultant for Chico State with a background on geospatial data, discussed the information found through mapping which highlighted the impact of income and other demographics during the months after the fire.
Aerial maps, which were primarily used to track the spread of wildfires, proved to be useful for providing public information during a crisis. But in order to understand the results of the fire, new forms of representational data needed to be considered.
“There’s good information out there but it’s not the easiest to access or put into the public,” Hansen said. “The National Infrared Operations send up a manned aircraft once a night…it’s a lot closer to the surface and they can get higher resolution feedback and use this as a mechanism to see where the fire is out already and where it’s the hottest.”
“You get higher precision. These are much more precise edges of the fire. At this stage of the game we don’t know what’s lost yet. We know it’s bad but we don’t know the edges yet,” Hansen said.
New data revealed parts of Paradise that have yet to recover and which demographics have continued to live in the town. Hansen noted that while the mapping and data presented during his forum include factual updates, they may not perfectly reflect all of the efforts from the region.
One of the primary uses for mapping included the ability to track the status of buildings which burned down and those that did not.
“People were really eager to see this come out and it was really a tool for a specific use…this was an emerging method from CALFIRE to document damage and by far the biggest effort. Kudos to all of the people that worked to make that happen,” said Hansen.
Hansen explained that he used a combination of data accumulated through surveys conducted by United Way, a social service provider with obtained county parcel data to pinpoint addresses to buildings. Hansen continued to explain that the ability to identify buildings with official addresses allowed volunteers to correctly identify structures that had been destroyed as well as fast track the process for survivors to verify their benefits quicker.
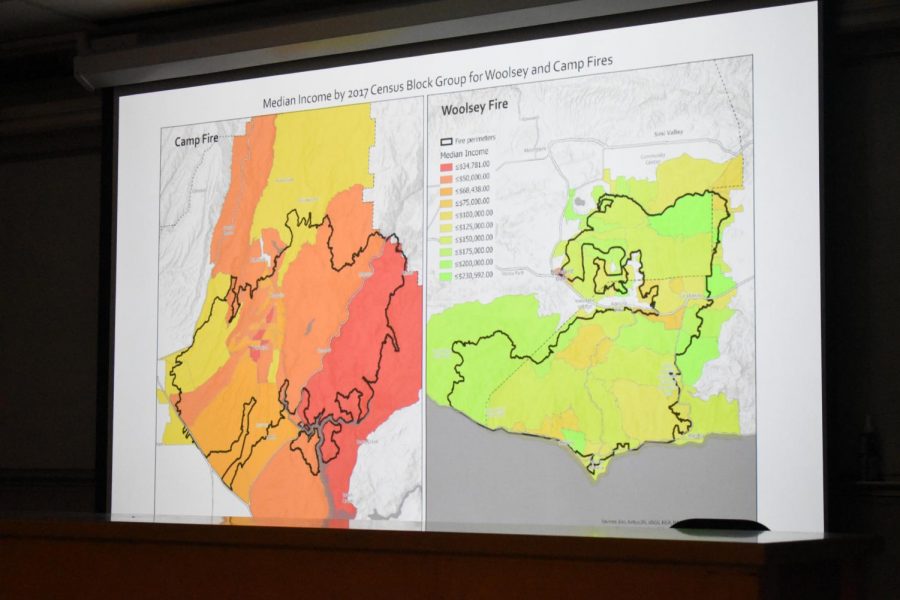
Mapping also revealed primary data which recognized the burn stain not only by household size but also through income.
Hansen compared the incomes of the Paradise community to the Los Angeles and Ventura communities which suffered through the Woolsey Fire. The communities, whose fires ignited on the same day, prompted a stark difference between the median incomes with Butte County bring much lower—elevating the question of whether certain communities could bounce back from disaster faster than others.
Hansen also explained that the data tracked households with individuals over 65 years old, raising mobility concerns.
Taking advantage of mapping datasets used by marketers, Hansen obtained 193,000 records which allowed him to identify the difference of locations where survivors relocated to. Observing certain demographics such as income and household size, data revealed that those who earned a higher income and had less dependents posed a higher chance of moving to Chico rather than families which had no choice but to stay local.
Ending the presentation, Hansen dressed that while everyone might have been affected equally, the ability to recover was not as distributed.
Kimberly Morales can be reached at [email protected] or @kimberlymnews on Twitter.